


Verification Flow With Specman
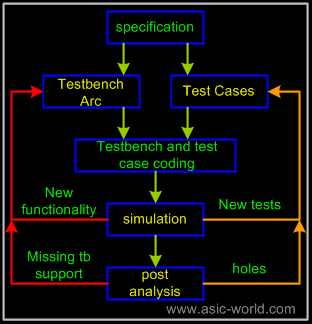
Verification flow with specman is same as with any other HVL's. Below figure shows the verification flow with specman.
Verification flow starts with understanding specification of the chip/block under verification. Once the specification is understood, test cases document is prepared, which documents all the possible test cases. Once test case document is done to a level, where 70-80 percent functionality is covered, testbench architecture document is prepared. In the past, testbench architecture document is prepared first and test case document is prepared next. There is a draw back with this style, If test case document show a particular functionality to be verified and If testbench does not support as architecture document was prepared before test cases document. If we have test cases document to refer to, then writing architecture documented becomes much easier, as we know for sure what is expected from the testbench.
Note: This section was written in a hurry, so it is very far from what I want it really to be!!!.
Test Cases
Identifying the test cases from the design specification is a simple task for simple cases. Normally any requirement in design specification becomes a test cases. Anything that specification mentions "Can do", "will have" becomes a test case. Corner test cases normally takes lot of thinking to identify.
Testbench Architecture
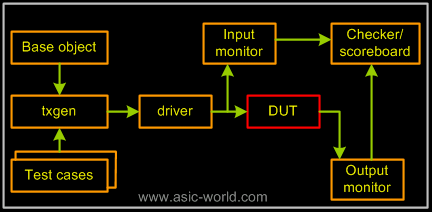
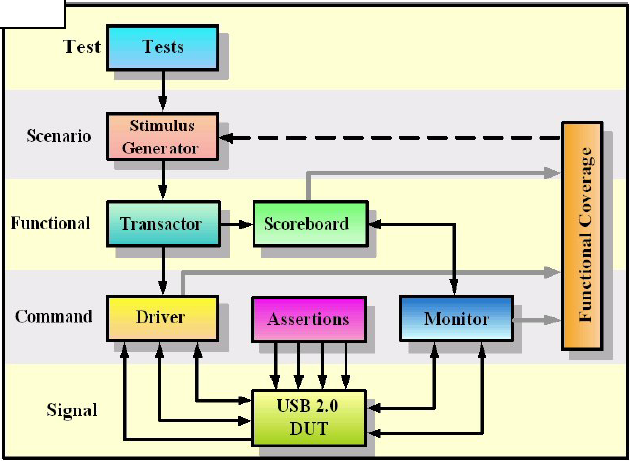
Typical TestBench architecture looks as shown below. The main blocks in a testbench are base object, transaction generator, driver, monitor, checker/scoreboard.
| The bock in red is DUT, and boxes in orange are testbench components. Coverage is a separate block, which gets events from input monitor and output monitor. This is same a scoreboard, but does something more. |
Base Object
Base object is the data struct that will be used across the testbench. Lets assume you are verifying a memory, then the base object would contain.
1 <'
2 struct mem_object {
3 addr : uint (bits:8);
4 data : uint (bits:8);
5 rd_wt : uint [0..100];
6 wr_wt : uint [0..100];
7 rd_wr : bool;
8 keep soft rd_wt == 50;
9 keep soft wr_wt == 50;
10
11 keep gen (wr_wt) before (rd_wr);
12 keep gen (rd_wt) before (rd_wr);
13 // Default operation is Write
14 keep soft rd_wr == FALSE;
15
16 keep soft rd_wr == select {
17 rd_wt : TRUE;
18 wr_wt : FALSE;
19 };
20 };
21 '>
Here mem_object is the name of the base object, same as we have module name for each module in Verilog or entity name in VHDL. Address, data, read, write are various field of the base object. Normally we have some default constrains and some methods(functions) which could manipulate the objects in the base object.
Transaction Generator
Transaction generator generates the transactions based on the test constrains. Normally the transaction generator applies test case constrains on the base object and generate base object based on constrain. Once generated, transaction generator passed this to driver.
A typical transaction generator would like below
1 <'
2 struct mem_txgen {
3 ! mem_base : mem_object;
4 //driver : mem_driver;
5 ! num_cmds : uint;
6 // This method generates the commands and
7 // calls the driver
8 genrate_cmds()@sys.any is {
9 for {var i:uint = 0 ; i < num_cmds; i+=1} do {
10 // Generate a write access
11 gen mem_base keeping {
12 it.addr == 0x10;
13 it.data == 0x22;
14 it.rd_wr == FALSE;
15 };
16 // call the driver
17 //driver.drive_object(mem_base);
18 };
19 };
20 };
21 '>
Driver
| Driver drives the base object generated by the transaction generator to the DUT. To do this, it implements the DUT input protocol. Something like below. |
1 <'
2 unit mem_driver {
3 event clk is rise('top.mem_clk') @sim;
4 // This method drives the DUT
5 drive_mem(mem_base : mem_object)@clk is {
6 wait cycle;
7 //Driver ce,addr,rd_wr command
8 'top.mem_ce' = 1;
9 'top.mem_addr' = mem_base.addr;
10 'top.mem_rd_wr' = mem_base.rd_wr;
11 if (mem_base.rd_wr == FALSE) {
12 'top.mem_wr_data' = mem_base.data;
13 };
14 // Deassert all the driven signals
15 wait cycle;
16 'top.mem_ce' = 0;
17 'top.mem_addr' = 0;
18 'top.mem_rd_wr' = 0;
19 'top.mem_wr_data' = 0;
20 };
21 };
 22 '>
 Input Monitor
 Input monitor monitors the input signals to DUT. Example in a Ethernet switch, each ingoing packet is picked by input monitor and passed to the checker.
Output Monitor
Output monitor monitors the output signals from DUT. Example in a Ethernet switch, each outgoing packet from the switch is picked by output monitor and passed to the checker.
Checker/Scoreboard
Checker or Scoreboards basically check if the output coming out of the DUT is correct or wrong. Basically scoreboards in e language are implemented using keyed list.
TestBench Coding
- Testbench coding starts after the testbench arch document is complete, typically we start with base object
- transaction generator
- driver
- input monitor
- output monitor
- scoreboard
If the project is big, all the tasks can start at same time, as many engineers would be working on them.
Test Case Execution
In this phase, test execution teams executes the test cases based on the priority. Typically once the focused test cases are passing and some level of random test cases are passing, we move to regression. In regression all the test cases are run with different seeds every time there is change in RTL.
Post Processing
In post processing code coverage, functional coverage is checked to see if all the possible DUT functionality is covered.
Code Coverage
Code coverage shows which part of the RTL is tested, thus is used a measurement to show how good DUT is verified. Also code coverage shows how good the functional coverage matrix is
| There are many types of code coverage as listed below. | ||
| . |
| . |
Line Coverage
Line coverage or block coverage or segment coverage shows how many times each line is executed.
Branch Coverage
Branch coverage shows if all the possible branches of if..else or case statements are reached or not.
Expression Coverage
| The golden of all coverage types. Expression coverage shows if all possible legal boolean values of a expression is reached or not. Generally expression coverage of 95% and above for large design is considered good. |
Toggle Coverage
Toggle coverage shows which bits in the RTL has toggled. Toggle coverage is used for power analysis mainly.
FSM Coverage
The FSM coverage shows, if all stats are reached, if all the possible state transition have happened.
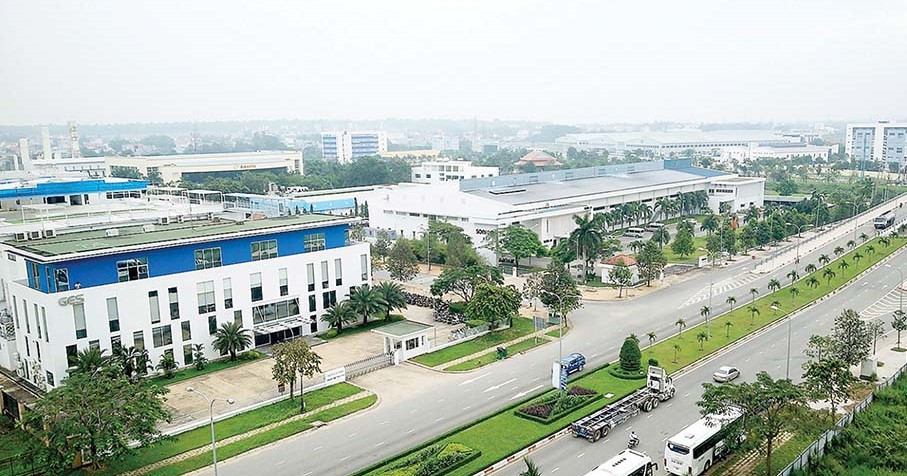
Bạn Có Đam Mê Với Vi Mạch hay Nhúng - Bạn Muốn Trau Dồi Thêm Kĩ Năng
Mong Muốn Có Thêm Cơ Hội Trong Công Việc
Và Trở Thành Một Người Có Giá Trị Hơn
Mong Muốn Có Thêm Cơ Hội Trong Công Việc
Và Trở Thành Một Người Có Giá Trị Hơn
Bạn Chưa Biết Phương Thức Nào Nhanh Chóng Để Đạt Được Chúng
Hãy Để Chúng Tôi Hỗ Trợ Cho Bạn. SEMICON